17% above
Costs more than others charge for this score
The 151 models with a score between 4.4 and 5.4 have a median price of $400.
This monitor$468
Median score 4.4 to 5.4$400
 Monitor Radar
Updated 18 Nov 2026
$468
Today’s price
checked today
Affiliate link: if you buy, the store pays us a commission, at no cost to you. How we make money
Details (tap to open)
Updated Nov 18, 2026
The final price is the one at the store.
Specs: score 4.9 of 10 Above the median on 2 componentes.
No data on the spec sheet: connections, ergonomics and recency. How we calculate the score
Weighted average of 5 spec sheet items, each from 0 to 10. The score does not measure the real calibration.
By today’s numbers, only if the strong point is what you need: price counts against it.
17% above
The 151 models with a score between 4.4 and 5.4 have a median price of $400.
#48 of 202
Among the 202 models in the $270 to $540 range, the median score is 3.9.
+1.0 in image
Pixel density (resolution divided by screen size), panel type (OLED, IPS, VA, TN) and stated HDR above what the range delivers.
0 weaknesses
Difference of each score from the range median:
Hover over a dotTap a dot to see the monitor, the price and the score. Gray dots are the rest of the catalog.
Price divided by size, compared with the monitors of similar size in today’s catalog.
$19.52 per inch
The 429 models from 22 to 27 inches cost $11.11 per inch (median). Math: $468 ÷ 24 inches.
Cheaper, with a similar score
ViewSonic XG2431 wins on smoothness (10.0 vs. 7.0)
Compare side by sideDirect competitor in the range
AOC 24E4CV wins on smoothness (8.5 vs. 7.0)
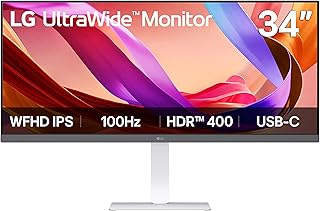
Compare side by sideClose in price and score
AOC 24P4CV wins on smoothness (8.5 vs. 7.0)
Compare side by sideAOC
Q27G2S$456
Today’s price
checked today
Who it’s forCompetitive gaming
Pros109 ppi · above average
LG
34U530A$467
Today’s price
checked today
ProsVESA
Cons82 ppi · below average
Samsung
LC34G55TWW$470
Today’s price
checked today
Who it’s forCompetitive gaming
Pros110 ppi · above average
ConsNo USB-C · No built-in speaker
| Screen | |
|---|---|
| Type | General use and office |
| Size | 24 ″ |
| Resolution | Full HD |
| Pixel density | 92 ppi |
| Panel | IPS |
| Aspect ratio | 16:9 |
| Line | UltraSharp |
| Smoothness | |
| Refresh rate | 120 Hz |
| General | |
| Model code | U2424H |
The catalog doesn’t say: curved screen, stated hdr, response time (stated), response time measurement, sync, hdmi ports, displayport ports, usb-c, usb-c with laptop charging, built-in speaker, height adjustment, pivot (portrait mode), vesa mount holes, colour and release year.
In 18 November 2026, Dell U2424H costs $468 (score 4.9); the range median is $365 across 202 models. The 0 to 10 score comes from the specs (image, smoothness, connections, ergonomics and recency), calculated by the Radar. The final price is the one at the store.
Today's best price is $468, checked in Nov 18.
On 18 Nov 2026, the collected price of Dell U2424H is $468. It’s a trusted seller’s price on the date it was checked; the final price is the one at the store.
Price counts against it: the 151 models with a score between 4.4 and 5.4 have a median price of $400, and Dell U2424H costs $468, 17% above. In the $270 to $540 range, the median score of the 202 models is 3.9; Dell U2424H's is 4.9, above the previous check, the 48º among them. By the spec sheet, the strong point is Image (3.5, vs. 2.5 at the range median); no component is more than 1 point below the range median. The score comes from the specs and doesn’t measure the real calibration or durability.
The catalog confirms IPS. Not confirmed in the specs: 144 Hz or more, QHD, 4K, OLED, USB-C, curved screen and height adjustment. Not confirmed doesn’t mean that the monitor doesn’t have it.
Source: Amazon.ca catalog, checked on Nov 18, 2026.
Procuramos em Amazon. Lowest price seen for the product on Amazon.ca, delivered to Toronto M5V 3L9, on the day it was read, before GST/HST.
Lowest price seen for the product on Amazon.ca, delivered to Toronto M5V 3L9, on the day it was read, before GST/HST. The model is the brand plus the name of the monitor; the versions go in the table. The price range, the median and the position use only models with a score; the price comparison looks at models whose score is within 0.5 points.
The spec score doesn’t measure the real calibration or durability, and the strong or weak point reading is just a comparison of numbers, not a buying recommendation.