

Asus VA279QG
Today
Typical price$189
Amazon: the cheapest today among the stores checked
3.7 out of 10 on the spec sheet
Buy on Amazon Monitor Radar
Updated 12 Nov 2026
Asus VA279QG costs $1 less today; MSI 272F has score 0.1 higher (3.8 vs. 3.7).
3.7score
3.8score · higher
Asus wins 1by componentMSI wins 2
Asus VA279QG is $1 the cheaperMSI 272F is the cheaper
By the spec rule for each use, the same one the lists on this site use.
Only Asus VA279QG works: General use, 23″ to 27″.
Only MSI 272F works: 144 Hz or more and a stated 1 ms.
Both work. Asus VA279QG is $1 cheaper.
Both work. Asus VA279QG is $1 cheaper.
Neither one fits: Monitors for creative work (photo and video), Monitors to use two on the desk.
Asus VA279QG wins on connections; MSI 272F wins on image and smoothness.
Amazon: the cheapest today among the stores checked
3.7 out of 10 on the spec sheet
Buy on AmazonAmazon: the cheapest today among the stores checked
3.8 out of 10 on the spec sheet +0.1
Buy on AmazonAffiliate links: if you buy, the store pays us a commission at no cost to you.
First data point for one of the two: the chart appears as the days go by.
Still only a few days of data for both to read the trend; the chart fills in as the days go by.
Updated 12/11/2026
Price divided by size and running cost, side by side.
| Math | Asus VA279QG | MSI 272F |
|---|---|---|
| Price per inch | $7.00 menor | $7.02 |
| Item | Asus VA279QG | MSI 272F |
|---|---|---|
| Screen | ||
| Type changes | General use and office | Gaming (144 Hz or more) |
| Size | 27 ″ | 27 ″ |
| Resolution | Full HD | Full HD |
| Pixel density | 82 ppi | 82 ppi |
| Aspect ratio | 16:9 | 16:9 |
| Stated HDR changes | not listed | HDR |
| Smoothness | ||
| Refresh rate changes | 120 Hz | 200 Hz |
| Response time (stated) changes | not listed | 0.5 ms |
| Sync changes | not listed | FreeSync |
| Connections | ||
| HDMI ports | 1 | 1 |
| DisplayPort ports changes | 1 | not listed |
| Ergonomics | ||
| VESA mount holes changes | not listed | Yes |
| General | ||
| Model code changes | VA279QG | 272F |
 Asus VA279QG orLG 27G414B$185 · score 3.6Compare
 MSI 272F orAcer KG270$186 · score 4.2Compare
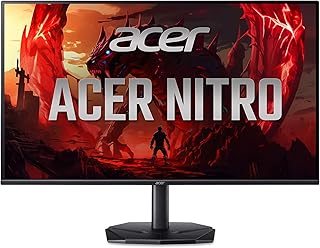 Asus VA279QG orAcer KG240Y$154 · score 5.5Compare
 MSI 272F orAsus VZ27EHF$190 · score 3.2Compare
 Asus VA279QG orMSI G242L$150 · score 4.7Compare
 MSI 272F orViewSonic VS2725$197 · score 3.8Compare
Source: Amazon.ca catalog, checked on 12/11/2026.
Lowest price seen for the product on Amazon.ca, delivered to Toronto M5V 3L9, on the day it was read, before GST/HST. The model is the brand plus the name of the monitor; the versions go in the table. The price range, the median and the position use only models with a score; the price comparison looks at models whose score is within 0.5 points.
The spec score doesn’t measure the real calibration or durability, and the strong or weak point reading is just a comparison of numbers, not a buying recommendation.