
Which monitor is better? Compare two
234 new monitors to compare on price, score and specs; collected 17 Nov.
Pick a size. Applies to all pages ·
234 new monitors, catalog as of 17 Nov 2026. The page address saves your choice.
- No proven discount6.56.5
BenQ
EW270Q£199
Best price at GamingKitchecked today
No public coupon today · the store may release one just for you on the page, be sure to checkWhy choose it
Who it’s forCreative work (photo and video)
Pros200 Hz · above average · Sound
ConsNo height adjustment
- No proven discount8.18.1
BenQ
PD2706U£376
Best price at GamingKitSee price in the store
No public coupon today · the store may release one just for you on the page, be sure to checkWhy choose it
Who it’s forCreative work (photo and video)
Pros163 ppi · above average
ConsNo built-in speaker
 ABenQ EW270Q
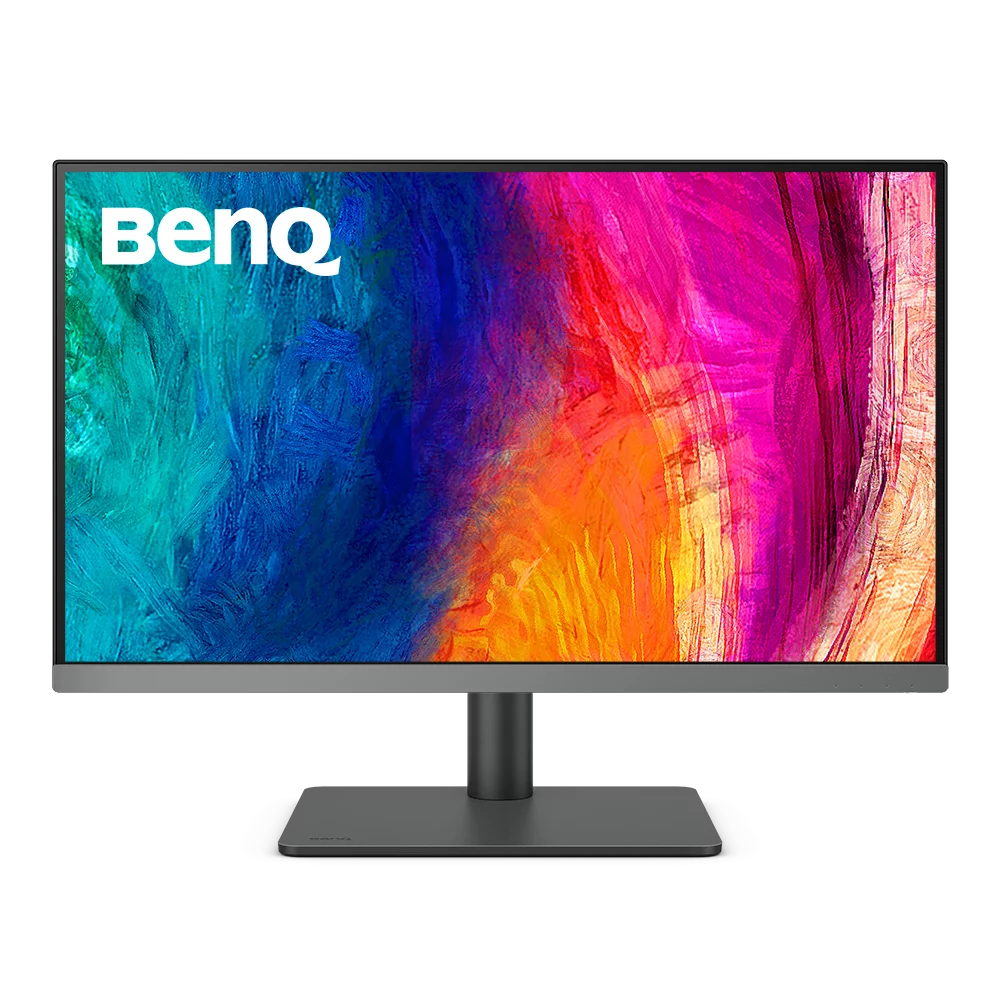 BBenQ PD2706U
BenQ EW270Q wins in 4 fields, BenQ PD2706U in 6.
What each one has that the other lacks
- ABenQ EW270Qwins in 4
- BBenQ PD2706Uwins in 6
- Collected price: BenQ EW270Q wins with $199 against $376, 177 £ less. The price collected today, from a trusted seller.
- Spec sheet score: BenQ PD2706U wins with 8.1 against 6.5, +1.6 pts. Sum of image, smoothness, connections, ergonomics and recency.
- image score: BenQ PD2706U wins with 9.5 against 4.6, +4.9 pts.
- connections score: BenQ EW270Q wins with 8.0 against 3.0, +5.0 pts.
- ergonomics score: BenQ PD2706U wins with 10.0 against 3.0, +7.0 pts.
- Pixel density: BenQ PD2706U wins with 163 ppi against 109 ppi, +54 ppi. Sharper text and images.
- Response time (stated): BenQ EW270Q wins with 1.0 ms against 5.0 ms, +4.0 ms. Number stated by the manufacturer; GtG and MPRT can’t be compared.
- Sound: BenQ EW270Q has it, BenQ PD2706U does not.
- Height: BenQ PD2706U has it, BenQ EW270Q does not.
- Pivot: BenQ PD2706U has it, BenQ EW270Q does not.
See full specsHide specs
| Field | BenQ EW270Q | BenQ PD2706U |
|---|---|---|
| Price and score | ||
| Collected price | $199 | $376 |
| Spec sheet score | 6.5 | 8.1 |
| Score by component | ||
| image score | 4.6 | 9.5 |
| smoothness score | 9.5 | no data |
| connections score | 8.0 | 3.0 |
| ergonomics score | 3.0 | 10.0 |
| recency score | no data | 8.5 |
| Spec sheet | ||
| Type | General use and office | General use and office |
| Screen size | 27.0 ″ | 27.0 ″ |
| Colour | no data | no data |
| Release year | no data | 2025 |
| Image | ||
| Resolution | QHD | 4K |
| Pixel density | 109 ppi | 163 ppi |
| Panel | IPS | IPS |
| Stated HDR | no data | HDR 400 |
| Curved screen | no | no |
| Aspect ratio | 16:9 | 16:9 |
| Smoothness | ||
| Refresh rate | 200 Hz | no data |
| Response time (stated) | 1.0 ms | 5.0 ms |
| Sync | FreeSync Premium | FreeSync |
| Connections | ||
| HDMI ports | 1 | no data |
| DisplayPort ports | 1 | no data |
| USB-C | yes | yes |
| USB-C with laptop charging | no data | yes |
| Built-in speaker | yes | no |
| Ergonomics | ||
| Height adjustment | no | yes |
| Pivot (portrait mode) | no | yes |
| VESA mount holes | yes | yes |
Prices as of 17/11, they may change at the store. Score by specs, from 0 to 10. How we calculate →
Next step
Still undecided between the two?
See where each one stands among all the new monitors, by price and score.
Frequently asked questions
What does the comparison show?
Price, spec sheet score, the score for each component (image, smoothness, connections, ergonomics and recency) and the spec sheet. On each row with a rule, we mark the one that wins.
Why do some fields show "no data"?
Because the catalog doesn’t list that detail for the monitor, and we’d rather show the gap than make up a number. A field with no data on one side doesn’t count for either.
Where does the price of each monitor come from?
This is the lowest price from a trusted seller on the date we checked. It changes without notice. The buy button goes straight to the store, where the price of the day applies.
Read next
Where the numbers come from
Lowest price seen for the product on Amazon.co.uk, delivered to London SW1A 1AA, on the day it was read, including VAT. Who wins on each row: the highest value for score and for fields where more is better; the lowest for price. Fields where higher doesn’t mean better appear without marking a winner.
The comparison uses the catalog specs and the Radar spec score. It doesn’t measure the real calibration, durability or what buyers think.
Data from 17 Nov 2026.