
Updated Nov 6, 2026
How many inches of monitor? The pixel density math
Size, resolution and the ppi that ties the two together.
How many inches fit on your desk without the text losing sharpness?
See the ppi mathStep 1 of 4
The sharpness math
Pixels per inch: ppi.
What makes text sharp is the combination of size and resolution: the pixel density, measured in ppi (pixels per inch). The math is this:
ppi = square root of (width² + height²) divided by the inches
The root is the screen diagonal in pixels. A Full HD monitor has 1920 by 1080 pixels and a diagonal of about 2,203 pixels; at 24″, that gives 92 ppi. Stretching the same resolution to 32″, the pixels get bigger and the density drops. The examples:
| Size | Resolution | Pixel density |
|---|---|---|
| 24″ | Full HD | 92 ppi |
| 27″ | Full HD | 82 ppi |
| 27″ | QHD | 109 ppi |
| 27″ | 4K | 163 ppi |
| 32″ | Full HD | 69 ppi |
| 32″ | 4K | 138 ppi |
| 34″ | UWQHD | 110 ppi |
Radar calculation with the resolution of each name (Full HD 1920 by 1080, QHD 2560 by 1440, UWQHD 3440 by 1440, 4K 3840 by 2160). Each monitor’s page shows the calculated density.
Step 2 of 4
What the Radar does with density
From the low end to the high end, in the picture score.
In the spec sheet score, pixel density is worth 0 to 6 points of the picture score: 70 ppi is worth zero and 160 ppi is worth the maximum, with a straight scale in between. It’s an editorial choice by the Radar for comparing spec sheets. It doesn’t say how far away you sit, and people who sit closer notice the difference more. Size itself is left out of the score.
That’s why the chart’s size bar is separate: you pick the inches and compare the monitors within the range. These are the ranges and what today’s catalog shows:
| Size | Monitors | Median density | Median price |
|---|---|---|---|
| Up to 22″ | 16 | 100 ppi | $89.00 |
| 23″ a 24″ | 66 | 92 ppi | $117.00 |
| 25″ a 27″ | 180 | 109 ppi | $199.00 |
| 28″ a 32″ | 73 | 138 ppi | $392.00 |
| 34″ or more | 80 | 86 ppi | $498.00 |
Catalog of 06/11/2026. The median is the middle value. A range with fewer than 3 monitors doesn’t appear, and the price of each range mixes different resolutions and types.
Step 3 of 4
Which size for which desk
Close-up work calls for density; gaming and movies call for screen.
For text, spreadsheets and classes, the Radar’s rule is that letters look sharp without scaling up: 24″ at Full HD e 27″ at QHD are the combinations where that happens. At 27″ Full HD the density drops to 82 ppi, and the text looks less defined. From 32″ up, QHD or 4K stop being a luxury and become what keeps the text readable. For gaming and movies, the bigger screen weighs more and the density less. The resolution choice is in a separate guide, and the main guide starts from the use.
Step 4 of 4
If it’s two monitors
Two 24″ monitors take up about 1.1 m of desk.
Two 24″ monitors side by side take up about 1.1 m of desk. It’s an editorial rule of the Radar, and the real width varies with each model’s bezel, which the specs rarely list. Measure your desk first. Height adjustment and VESA mount holes (the pattern of holes for an articulated arm) help line the two up. Two monitors of the same model tend to have the same color and the same bezel size. If the desk is narrow, an ultrawide monitor can do the same job: see is an ultrawide worth it.
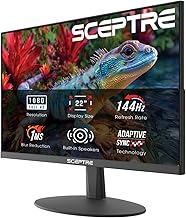
82 of the 415 monitors in the catalog pass this rule. Their median price is $110.00 and the spec score median is 3.3. The cheapest:


How we read size
- 415monitors in the catalog
- 06/11price date
Text sharpness comes from pixel density, the math that combines inches and resolution, and not from size alone. The Radar calculates the ppi of each monitor and leaves inches out of the score, as a purchase choice. Catalog of 06/11/2026: 415 monitors, median price of $224.00.
| Part of the calculation | Rule |
|---|---|
| Pixel density (ppi) | square root of (width² + height²) divided by the inches |
| Picture score range | from 70 ppi (zero) to 160 ppi (maximum) |
| Size in the score | left out: it’s a purchase choice |
| Minimum monitors per range in the table | 3 for the range to appear |
The best by price range
Next step
See the monitors that fit your criteria
Each point is a new monitor, by price and spec score.
Frequently asked questions
How many inches of monitor are good for working?
For sharp text without scaling up, 24″ at Full HD and 27″ at QHD. At 27″ Full HD the pixel density drops and the letters look less defined. The Radar reads the spec sheet and doesn’t know how far away you sit, so the final choice is yours.
What is ppi and how is it calculated?
It’s pixel density, pixels per inch. The math is the square root of width squared plus height squared, divided by the inches. At 24″ Full HD it comes to about 92 ppi; at 27″ 4K, about 163. Each monitor’s page shows the value calculated by the Radar.
Is a 27-inch Full HD monitor worth it?
It works, but the letters look less defined than at QHD, because the same pixels cover a bigger screen. For gaming and video, plenty of people accept it. For close-up text, the Radar suggests QHD at 27″. The price difference between the two resolutions appears in the resolution guide.
How many inches should I choose for two monitors on the desk?
The Radar’s rule is up to 24″, because two 24″ monitors side by side take up about 1.1 m. The real width changes with each model’s bezel, so measure your desk. Height adjustment and VESA mount holes help line up the screens.
Does screen size count toward the Radar score?
No. Size is a purchase choice, and the score compares monitors of the same type by the specs: picture, smoothness, ports, ergonomics and how current it is. Pixel density counts toward the picture, because it depends on resolution and size together.
How much does a monitor cost today in the catalog?
Today there are 415 monitors in the 06/11/2026 catalog, with a median price of $224.00 and the cheapest from $63.00. The price varies with size, resolution and type, and the range table shows the median for each size.
How do I read the chart?
Each dot is a new monitor. The further right, the more expensive; the higher up, the better the spec sheet score. The price uses a logarithmic scale: each step is worth more dollars than the one before, so the cheaper ones don’t get bunched together. The line connects the monitors that no other, among those filtered, beats on both score and price at once. Compare monitors of the same size: pick the inch range in the top bar.
Where does the score come from?
From the monitor’s spec sheet, with public weights (image, smoothness, connections, ergonomics and recency). The score compares within the type: the Hz of an office monitor are measured against the office yardstick, those of a gaming monitor against the gaming one. It shows what the spec sheet states, not the calibration or the measured brightness. Size doesn’t count toward the score. The full calculation is in How we calculate the score.
Why do some monitors appear without a score?
Because the store’s spec sheet doesn’t give enough information: we need at least three components of the score. We’d rather leave a monitor without a score than make one up. Those monitors stay off the chart and remain in the table, with the price and the button to compare stores.
How many inches do I need?
For a work desk, 24″ at Full HD and 27″ at QHD are the sizes where text looks sharp without scaling up. At 27″ Full HD the density drops to 82 pixels per inch and the text looks less defined; 32″ calls for QHD or 4K. Each monitor’s page shows the pixel density calculated by the Radar.
Is the price on the chart what I’ll pay?
This is the lowest price from Amazon.com, a direct store, the manufacturer’s official store or a seller rated 4.0 with 100 or more sales, usually paying upfront, on the date we checked. It changes without notice, and the color can change the price. The buy button goes straight to the store, where the price of the day applies.
Read next
Where the numbers come from
Pixel density is calculated by the Radar from the resolution and inches in the spec sheet (ppi = square root of (width² + height²) / inches, rounded). In the picture score it is worth from 70 ppi (zero) to 160 ppi (maximum), and inches are left out of the score. The median of each size range comes from the catalog of 06/11/2026, with at least 3 monitors per range. The Radar doesn’t know how far away you use the monitor.
The guide helps you decide and doesn’t recommend a monitor for you: the final price is the one at the store, and the spec score doesn’t measure the real calibration or durability.
Data from Nov 6, 2026.